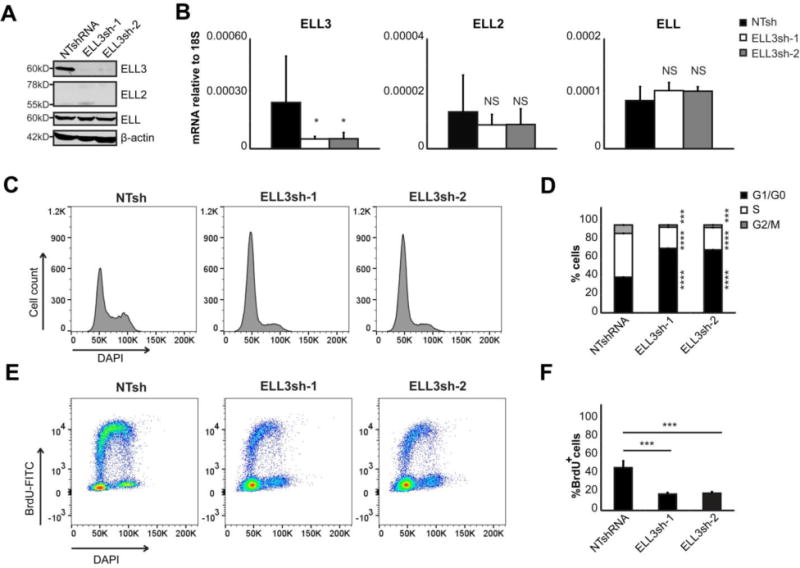
Figure 4. ELL3 depletion inhibits B cell proliferation and cell cycle progression.

Namalwa cells were transduced with either NTsh, ELL3sh-1, or ELL3sh-2. A. Immunoblot of ELL3, ELL2 and ELL. The equivalent of 0.5×10⁶ whole cell lysates were assayed. Data depicts representative images of 3 independent experiments. B. The relative mRNA quantitation of all ELL family members after ELL3 depletion. Data is presented as the average of 5 independent experiments; errors bars represent SD. *p<0.05; NS is not significant (two-tailed t-test). C. Representative total DNA content profile after ELL3 depletion measured by DAPI staining and flow cytometry. D. Cell cycle distribution after ELL3 depletion. Cells stained with DAPI for DNA content and gated on mCherry+ as marker of shRNA transduced cells. 150,000 cells were modeled with ModFit. Depicted are percentages at each stage of the cell cycle. E. Representative dual color fluorescence density plot of DNA-DAPI and BrdU-FITC from cells pulsed with BrdU after ELL3 depletion. F. DNA replication detected by BrdU pulse labeling (30 min) and modeled for at least 190,000 cells. Data is depicted as percentage of total mCherry+ cells. Data in panels C-F are from 2 biological independent experiments with 4 replicates each. All assays were performed on day 5 post-transduction. Errors bars represent SD in percentage. *p<0.05, **p<0.01, ***p<0.001, ****p<0.00001 (two-tailed t-test).
