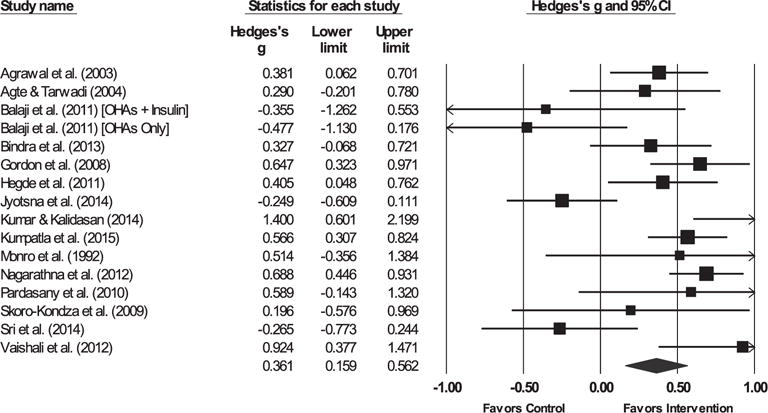
Fig. 2.

Forest plot for hemoglobin A1c.
Note. The sizes of the boxes are proportional to the weight of each individual study in the analyses.
The summary effect size is represented by a diamond. OHAs, oral hypoglycemic agents.

Forest plot for hemoglobin A1c.
Note. The sizes of the boxes are proportional to the weight of each individual study in the analyses.
The summary effect size is represented by a diamond. OHAs, oral hypoglycemic agents.