
Fig. 3.
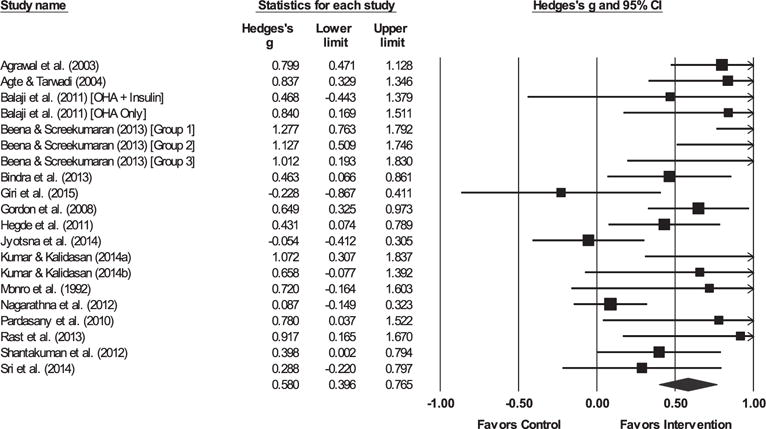
Forest plot for fasting blood glucose.
Note. The sizes of the boxes are proportional to the weight of each individual study in the analyses.
The summary effect size is represented by a diamond. OHAs, oral hypoglycemic agents.
Official websites use .gov
A
.gov website belongs to an official
government organization in the United States.
Secure .gov websites use HTTPS
A lock (
) or https:// means you've safely
connected to the .gov website. Share sensitive
information only on official, secure websites.
Forest plot for fasting blood glucose.
Note. The sizes of the boxes are proportional to the weight of each individual study in the analyses.
The summary effect size is represented by a diamond. OHAs, oral hypoglycemic agents.