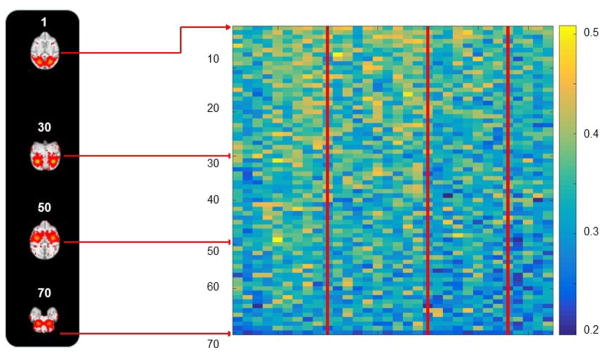
Fig. 12.
Spatial overlap rate between each of 70 ICNs template and corresponding ICNs in all 33 individual subjects. (a) 10 example ICN templates with one representative axial slice. (b) The spatial overlap rate matrix (70×33). The red lines separate the four age groups. Every identified 70 ICNs and 33 individual spatial map with the maximum overlap can be viewed by the web link: http://hafni.cs.uga.edu/MonkeyNewICNs/MonkeyBrain_NewTemplateComponentsSelectedByMeanStdOverlapSortMap_presentation.html. Most of the identified group-wised ICNs have a strong spatial overlap (>0.3) with individual spatial components (Lv et al., 2015 a, b; Smith et al., 2009), which indicates all identified group-wised ICNs are consistent.

