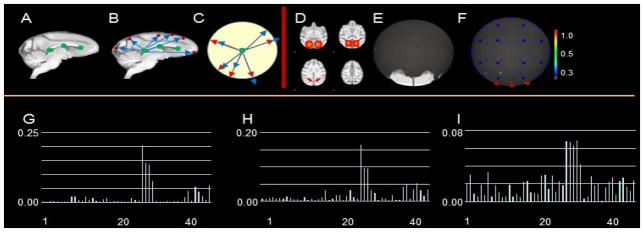
Fig. 5.
Illustration of the ‘connectivity map’ for representation of spatial pattern of ICN. (A) 3 selected projection centers (green points) along the corpus callosum of INIA19 template image for all ICN patterns across all subjects; (B) 2-D spatial map. The red dots represent the activated areas; (C) projection of spatial map (B) to a unit circle; (D) an example of identified spatial map; (E) projection of spatial map in (C) to unit sphere; (F) connectivity map for (D); (G)-(I) present the distributions for spatial map (D) in a ‘connectivity map’ including 48 points on 3 different projection centers, respectively.

