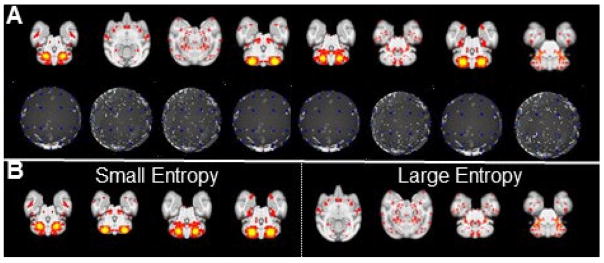
Fig. 6.
Examples identified as spatial patterns selected from individuals of ‘connectivity map’ representation of ICNs. (A) 8 example ICN patterns (first row) and corresponding ‘connectivity map’ representations (second row). (B) The four meaningful ICN patterns with small entropy values and the four ICN patterns with large entropy values which are more likely to be noise patterns.

