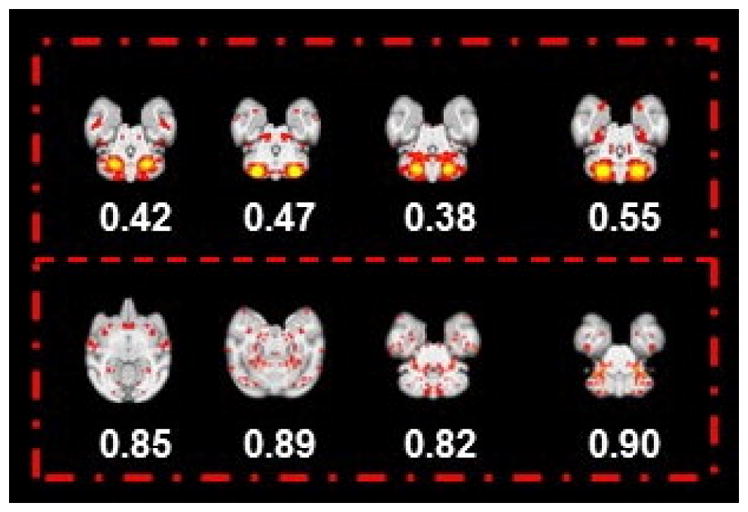
Fig. 7.

Eight examples identified as individual spatial patterns (the most informative slice) presented with their entropy values. The four representative slices in the first row indicate the meaningful spatial map with a relative smaller entropy value (<0.8); meanwhile, in the second row, another four representative slices are shown with the relative higher entropy value (>0.8). Obviously, by comparing the four slices in the second row with the first row, the spatial maps, in general, are much noisier with a larger entropy value. Based on our entropy analysis for 13,300 individual ICNs, we set the entropy threshold value as 0.6 in an effort to detect the noisy spatial patterns. Furthermore, experts’ manual examination for eliminated spatial pattern with larger entropy can guarantee that all spatial patterns used for clustering are meaningful.
