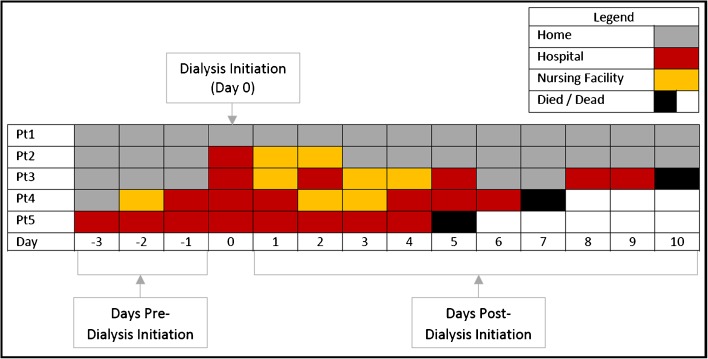
Figure 1.
Schematic representation of the “heat map.” For illustrative purposes, the schematic shows only 3 days pre-dialysis initiation and 10 days post-dialysis initiation for five hypothetical patients, while the actual heat maps extend to 120 days pre-dialysis and 365 days post-dialysis initiation. Each day is represented by a single box that is color-coded as indicated in the legend. Each patient is represented by one row in the heat map. For example, patient (Pt) 1 spent the 3 days pre- and 10 days post-dialysis initiation at home. Patient 2 had no facility days pre-dialysis initiation, was hospitalized at the time of dialysis initiation, and then spent 2 days in a nursing facility before going home. Patients 3 and 4 spent variable lengths of time in a facility before dying on days 10 and 7 post-dialysis initiation, respectively. Patient 5 was hospitalized from 3 days pre- through 4 days post-dialysis initiation before dying on day 5 post-dialysis initiation.

