Fig. 5.
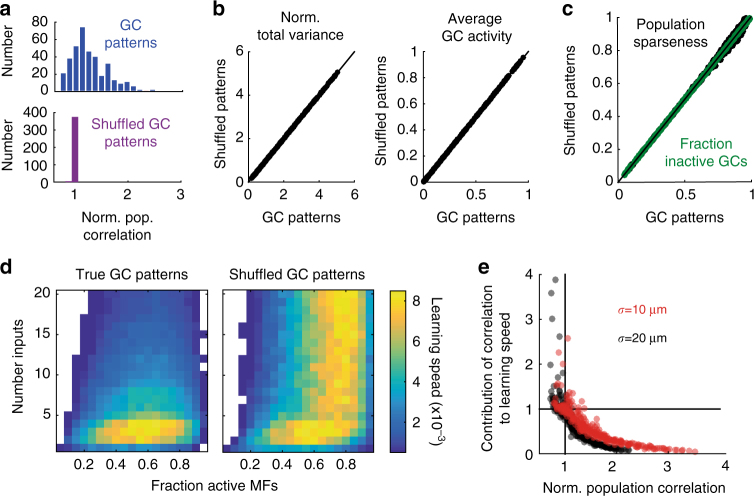
Separation of the effects of correlation on learning speed from expansion and population sparsening. a Histograms of the normalized population correlation (granule cell correlation/mossy fiber correlation) for granule cell (GC) patterns (top, blue) and shuffled GC patterns (bottom, purple). The narrow distribution around 1 indicates that the shuffled GC patterns have the same normalized population correlation as the mossy fiber (MF) patterns. b Normalized total variance (left) and average activity (right) for GC patterns (abscissa) versus shuffled GC patterns (ordinate). c Population sparseness (green) plotted for GC patterns (abscissa) and shuffled GC patterns (ordinate). Green indicates the fraction of inactive GCs for comparison as an alternate measure of population sparseness. d Raw learning speed for true GC patterns (left) and shuffled GC patterns (right). In both panels, MF inputs are correlated with a correlation radius of σ = 20 μm. e Change in learning speed due to correlations (i.e., GC speed/shuffled GC speed) plotted against the normalized population correlation. Each point represents different values of Nsyn and fMF. Correlation radii were σ = 10 μm (red) or 20 μm (black)

