Fig. 9.
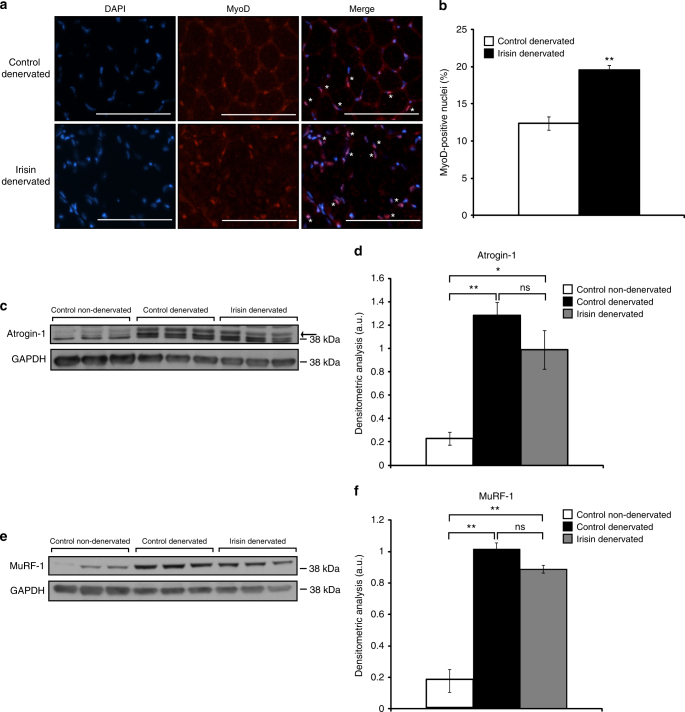
Irisin treatment rescues denervation-induced muscle atrophy. a Representative images of MyoD immunostaining of TA muscle sections from denervated mice injected with either DB (control) or irisin. Images were captured using a ×20 objective. Scale bar represents 100 μm. Nuclei were counterstained with DAPI. White asterisks denote MyoD-positive cells. Linear brightness and contrast of ‘Merge’ panel was adjusted to visualize MyoD+ nuclei without altering the interpretation of results in any way. b Graph displaying the percentage of MyoD-positive cells in TA muscle sections from denervated mice injected with either DB (control) or irisin pre and post sciatic nerve transection. c IB analysis of Atrogin-1 protein levels in Gas muscle from non-denervated mice injected with DB (control) and denervated mice injected with either DB (control) or irisin. The levels of GAPDH were assessed as a loading control. Arrow indicates Atrogin-1 band. d Graph shows densitometric analysis of Atrogin-1 levels in arbitrary units (a.u), normalized to GAPDH. e IB analysis of MuRF-1 protein levels in Gas muscle from non-denervated mice injected with DB (control) or denervated mice injected with either DB (control) or irisin. The levels of GAPDH were assessed as a loading control. f Graph shows densitometric analysis of MuRF-1 levels in a.u, normalized to GAPDH (n = 3 biological replicates). Error bars represent mean ± SEM. Student’s t-test was performed for b and one-way ANOVA was performed for d and f. Significance is indicated with *p < 0.05 and **p < 0.01

