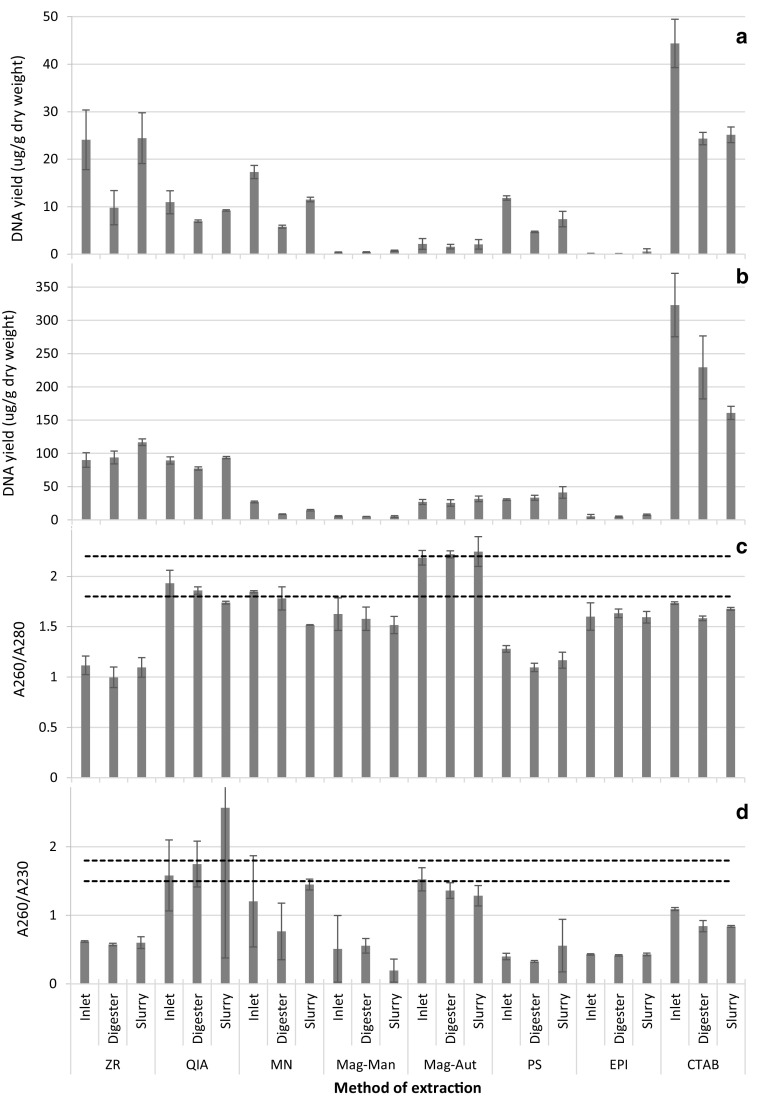
Fig. 1.
Yield and quality of DNA extracted from samples obtained from the inlet, digester and slurry using various methods of DNA extraction. a DNA quantified with Qubit. b DNA quantified with NanoDrop. c DNA quality determined by A260/A280 ratio. d DNA quality determined by A260/A230 ratio. Area between perforated lines in c and d is indicative of pure DNA, i.e. DNA with no protein contamination in c and DNA with no contamination by aromatic compounds, phenols and carbohydrates in d. Error bars represent standard deviation (n = 3)

