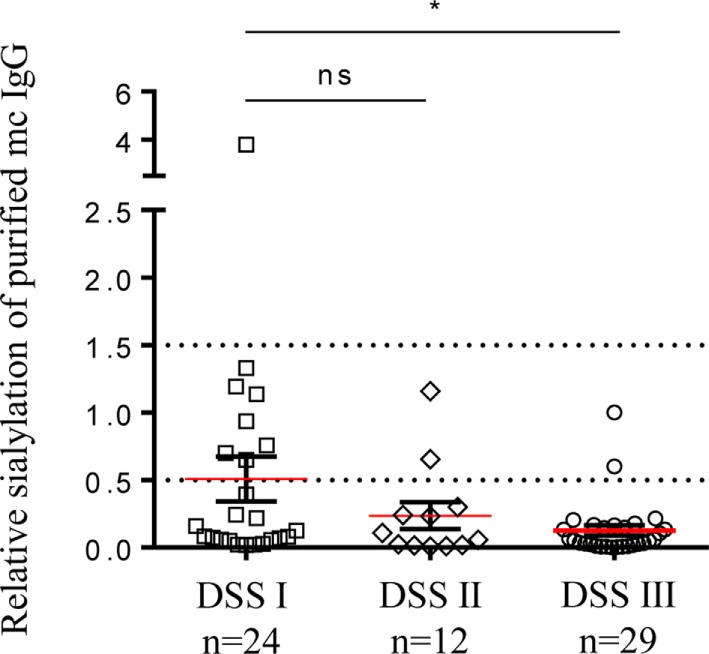
Figure 8.

Sialylation level of mc IgG from patients diagnosed with multiple myeloma (MM) at Durie–Salmon Staging (DSS) I, II, or III. Sialylation level of mc IgGs was compared among groups of MM patients with DSS stage I, II, or III. Horizontal bars indicate mean ± SEM. Statistical analysis was performed using Kruskall–Wallis test followed by Dunn’s Multiple Comparison test. *p < 0.05.
