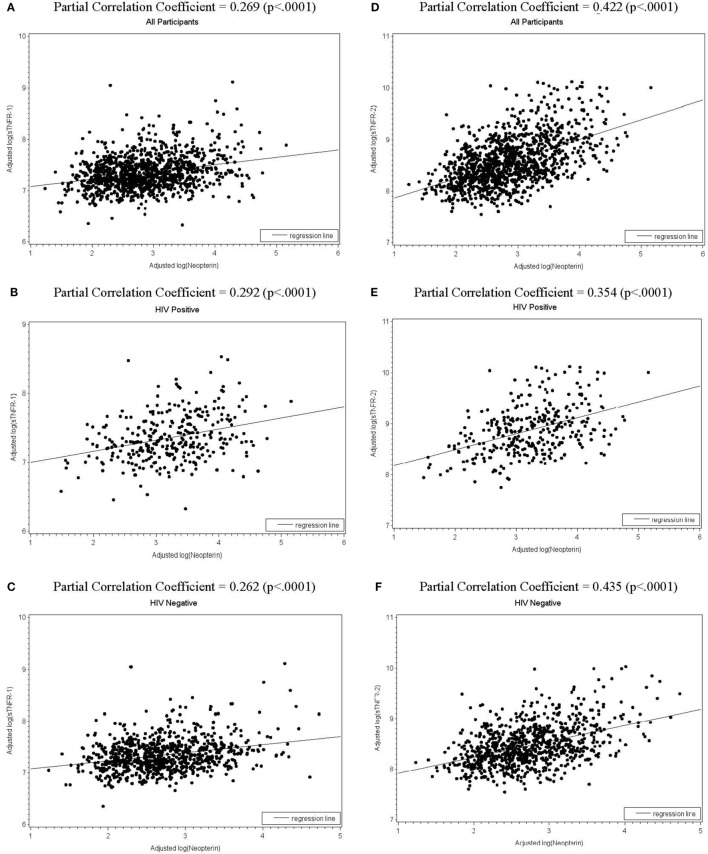
Figure 1.
Scatterplots of total (all participants), human immunodeficiency virus (HIV)-positive, and HIV-negative populations with regression line shows, respectively, the fitted relationships of log(neopterin) with log(sTNFR-1)(A–C) and with log(sTNFR-2) (D–F), adjusting for age, sex, race, number of comorbidities (0 or 1, 2, 3 or more), cigarette smoking, hepatitis C infection, body mass index, and number of injections in the past 30 days. CD4+ T-cell counts, HIV viral load, and combination antiretroviral therapy (cART) use in past 6 months were also adjusted for HIV-positive subgroup.

