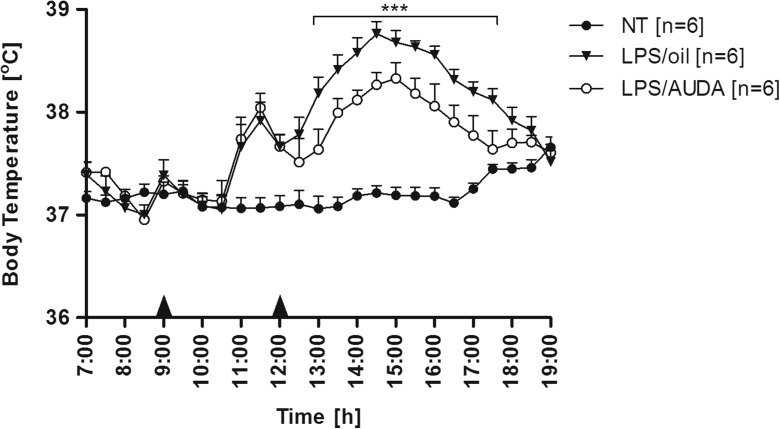
Fig. 3.
Changes of body temperature (°C) over time (h) of rats treated i.p. at 9:00 with LPS (50 μg/kg). Three hours afterwards, animals received intraperitoneally AUDA in a dose of 15 mg/kg (open circles) or 500 μL of olive oil (closed triangles) as a control. Closed circles represent normal circadian rhythm of body temperature in non-treated rats. Sample size is indicated in parentheses. Black arrowheads represent the time of injection. Values are means ± SEM at 30-min averages. Asterisks indicate significant difference (***p < 0.001) between “LPS/oil” and “LPS/AUDA” experimental groups

