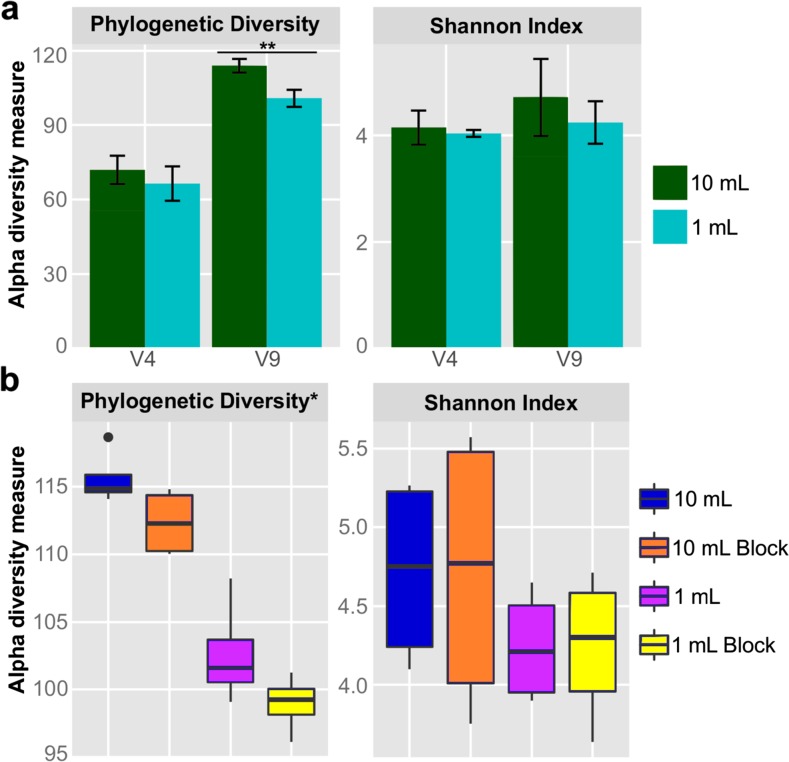
Fig. 3.
Alpha diversity analysis for sewage 18S communities using the phylogenetic diversity metric and Shannon Index. All analyses were calculated from replicate OTU tables sampled at a depth of 600,000 sequences. a Alpha diversity of the different extraction volumes for the V4 and V9 regions. Values shown represent the measurements from all 1 and 10 mL (fresh samples only) extraction volumes by region. Error bars represent ± one standard deviation; double asterisks indicates p value <0.001. b Alpha diversity of sewage samples based on extraction volume and blocking primer use for the V9 region. Asterisk indicates p value <0.01

