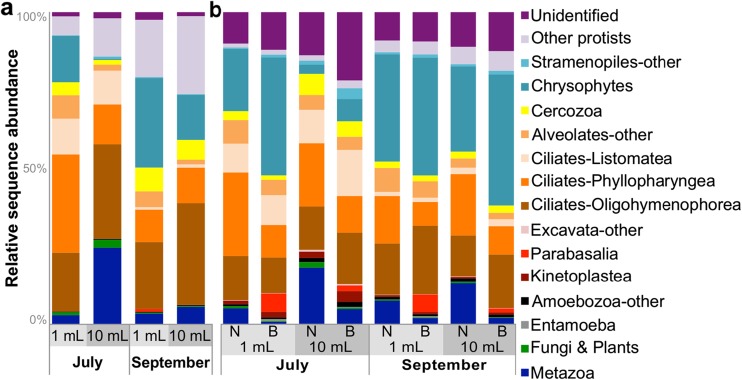
Fig. 4.
Relative sequence abundances of eukaryotic taxa across experimental conditions for each region. Each bar represents the average of two replicates per condition per time point. All data shown were from fresh extractions. a V4 region results from the 1 and 10 mL extractions. b V9 region results from the 1 and 10 mL extractions (with (B) and without (N) the blocking primer)

