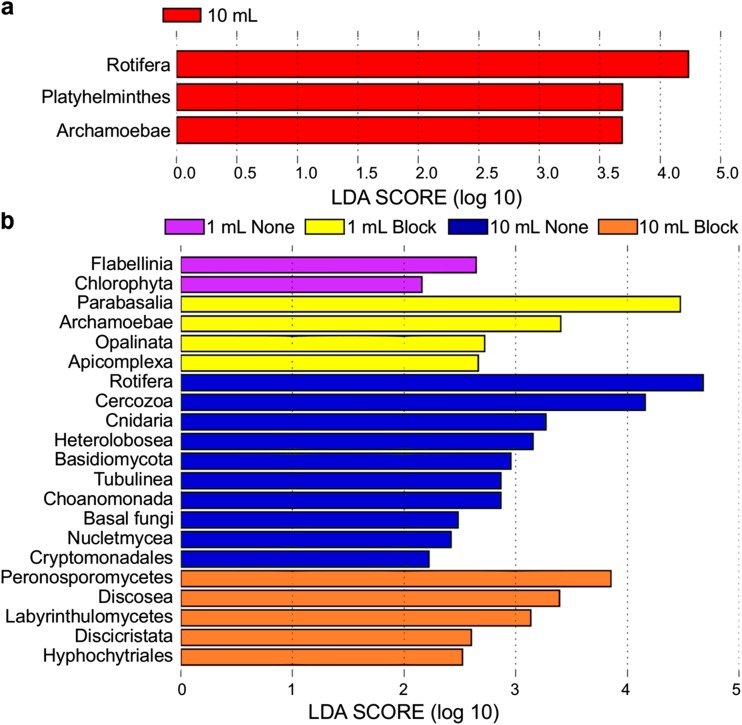
Fig. 5.
LEfSe analysis of 18S communities to determine biomarker taxa across sample groupings for each region. All data shown were from fresh extractions. LDA scores for taxa identified as differentially abundant between a 10 and 1 mL for the V4 region and b 1 mL, 1 mL blocking, 10 mL, and 10 mL blocking samples for the V9 region. Taxa are ranked according to their effect size (LDA score) and associated with the group with the highest median

