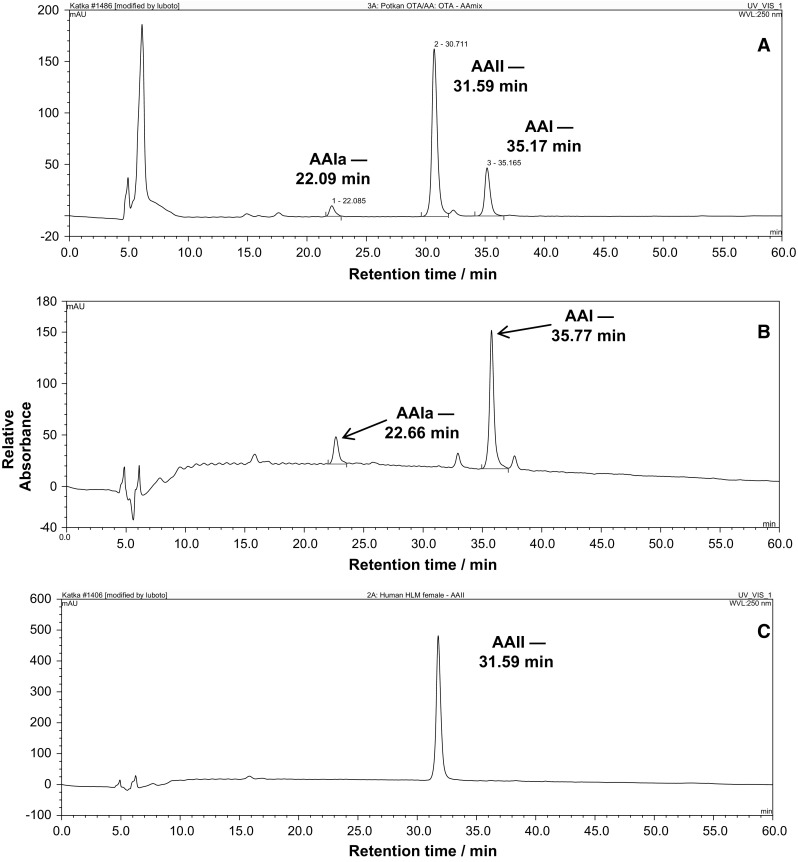
Fig. 2.

HPLC chromatogram of AA oxidation metabolites formed by hepatic microsomes of control rats incubated with AA and NADPH (a), that of AAI oxidation metabolites by the same microsomal fraction incubated with AAI and NADPH (b), and AAII metabolites formed by the same microsomal fraction incubated with AAII and NADPH (c). HPLC was carried out with a Nucleosil 100-5 C18, 25 × 4.0 mm, 5 mm (Macherey-Nagel) column, using a linear gradient of acetonitrile (20–60% acetonitrile in 55 min) in 100 mmol dm−3 triethylamonium acetate with a flow rate of 0.6 cm−3 min−1. A Dionex HPLC pump P580 with UV/VIS UVD 170S/340S spectrophotometer detector set at 254 nm was used. Peaks were integrated with CHROMELEON™ 6.01 integrator. A peak eluting at retention time (r.t.) 22.1 (22.7) min was identified as AAIa using mass spectroscopy analysis [38]
