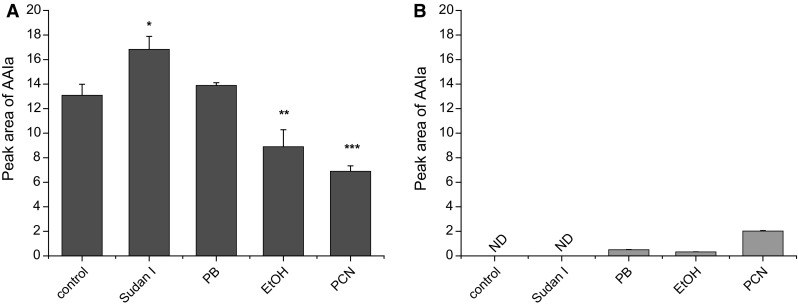
Fig. 3.

AAIa formation by rat hepatic microsomes from AAI (a) [38] and AAII (b). Values represent mean ± standard deviations from three independent experiments. ***P < 0.001, **P < 0.01, *P < 0.05 (Student’s t test), significantly different from incubations of AAI with control microsomes. ND not detectable
