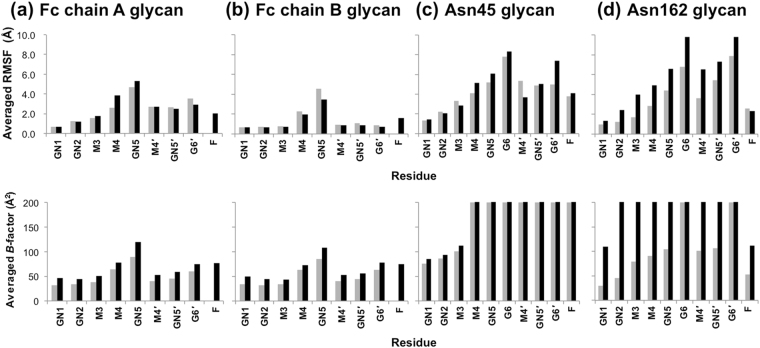
Figure 3.
RMSF and crystallographic B-factor values for sugar residues of N-glycans of IgG1-Fc and FcγRIIIa. Averaged RMSF and crystallographic B-factor of each residue in the IgG1-Fc/FcγRIIIa complexes are shown in the upper and lower panels, respectively: (a) Fc chain A glycan; (b) Fc chain B glycan; (c) Asn45 glycan; (d) Asn162 glycan. The values of the nonfucosylated and fucosylated systems are shown as gray and black bars, respectively. The B-factor values of crystallographically disordered residues are indicated as 200 Å2. The residues are designated as follows: GlcNAc1 (GN1); GlcNAc2 (GN2); Man3 (M3); Man4 (M4); GlcNAc5 (GN5); Gal6 (G6); Man4′ (M4′); GlcNAc5′ (GN5′); Gal6′ (G6′); Fuc (F).

