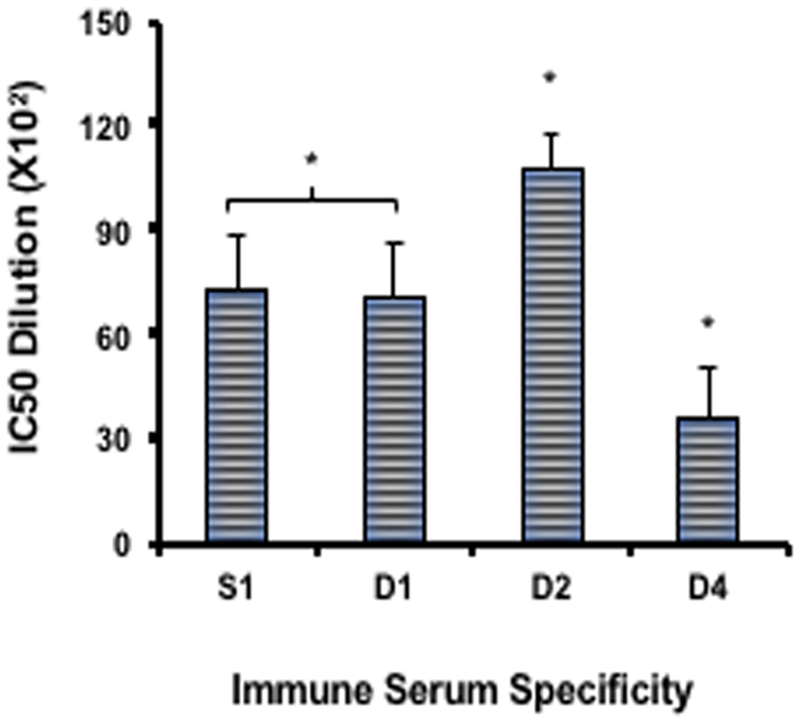
Figure 7.

Multiple comparisons of anti-DBPII binding-inhibitory responses. The overall inhibitory response of each antiserum against all four COS7 cell-expressed DBPII alleles was compared with Dennett’s adjustment multiple comparisons, with Sal1 as control. Bars represent the mean IC50 value of each serum dilution against all the variant DBPII alleles tested in the COS7 assay. Sera were placed into three groups (DEKnull-2, Sal1/DEKnull, and DEKnull-4). Asterisk (*) indicates a significant difference in the inhibitory responses between the immune sera from the DEKnull-2 group and the DEKnull/Sal1 group and the DEKnull-4 group (p = 0.05).
