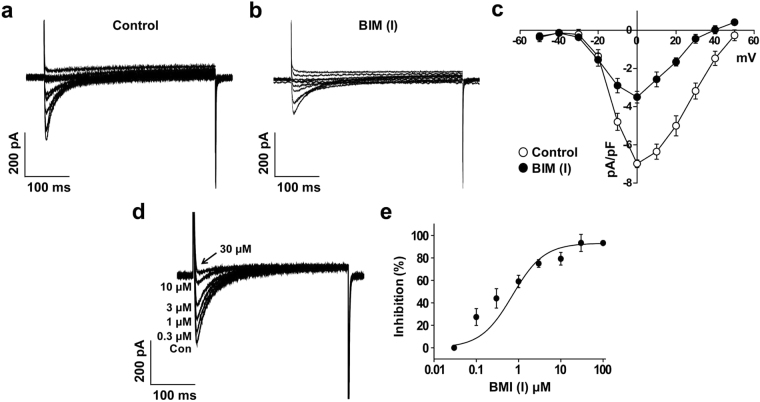
Figure 6.
The effect of BIM (I) on L-type Ca2+ current in hESC-CMs. Superimposed current traces under control conditions (a) and in the presence of BIM (I) (1 μM) (b) were obtained by applying the same pulse protocol for Fig. 3. (c) I-V relationship at the peak Ca2+ current in the absence (open circle) and presence of BIM (I) (1 µM) (closed circle). n = 6. *P < 0.05. (d) Superimposed current traces were recorded by applying one-step depolarization pulse of 0 mV from a holding potential of −50 mV in the presence of BIM (I) (0, 0.03, 0.1, 0.3, 1, 3, 10, 30, and 100 μM). (e) BIM (I)-induced inhibition of the L-type Ca2+ current was measured at peak current, and normalized to the current amplitude observed in the absence of BIM (I). Normalized currents were fitted with the Hill equation. n = 6.

