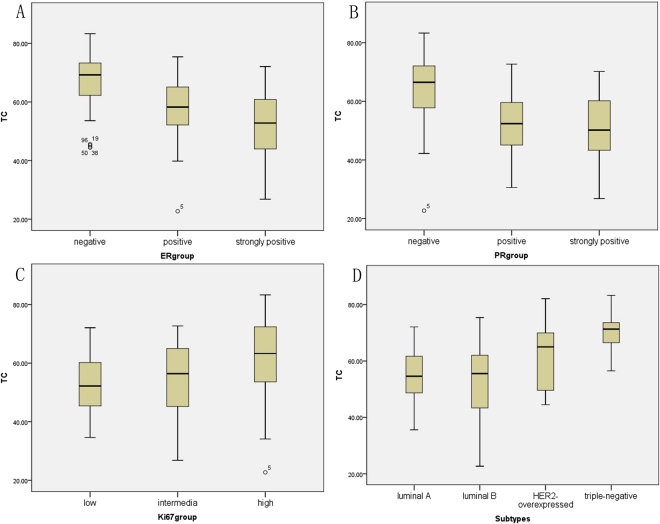
Figure 1.
Box plot between TC and subsets in biomarkers and subtypes. (A) the negative group showed the highest TC (67%) followed by the positive group (57.1%) and strongly positive group (51.9%). (B) the negative group showed the highest TC (64.3%) followed by the positive group (53.1%) and strongly positive group (50.7%) (C) the high subset showed the highest TC (62%) followed by the intermediate subset (54.6%) and low subset (52.8%). (D) TNBC got the highest TC (70.8%) followed by HER2-overexpressed subtype (61.6%), luminal A (54.7%) and luminal B (52.3%).

