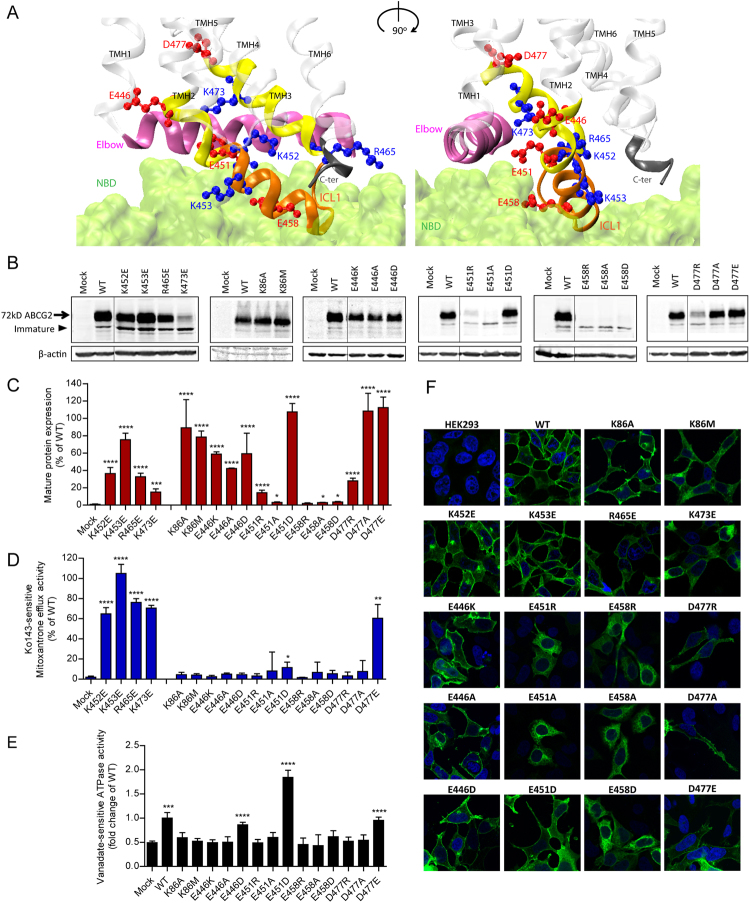
Figure 2.
Mutational analysis of the transmission interface. All charged resideus in the predicted TMH2, ICL1 and TMH3 were subjected to mutational changes as indicated. (A) Configuration at the transmission interface of a human ABCG2 monomeric half transporter in two views rotated by 90°, emphasizing the contacts of the transmembrane domain (TMD) with the NBD surface (green); ICL1 (orange); TMHs (transparent white); distal helical parts of TMH2 and TMH3 (yellow); elbow helix (pink); C-terminus (black). Charged residues are indicated as colored balls-and-sticks, positive charges (blue), negative charges (red); not drawn to atomic scale. (B) Immunodetection of ABCG2 variants using the monoclonal mouse anti-ABCG2 (BXP-21) antibody. Mature wild type (WT) ABCG2 migrates to approximately 72 kD, the bands below are immature unglycosylated monomers. β-actin was used as a loading control. (C) Quantified immunoblot using the Odyssey system from several independent experiments (n = 2–12). Mature ABCG2 and β-actin were gated, and ABCG2 signals were individually normalized to β-actin and shown as a percentage of WT. The blots from different gels were divided by the white spaces. (D) Mitoxantrone efflux in transfected HEK293 cells after incubation at 37 °C for 20 min in the presence and absence of Ko143. Ko143–sensitive mitoxantrone efflux is given as percentage relative to WT. Data are from several independent experiments (n = 2–7). (E) Vanadate-sensitive ATPase activity of ABCG2 variants in transfected HEK293 cells. Vanadate-sensitive ATPase activity is represented as a fold change relative to WT. Data are from several independent experiments (n = 8) using three batches of membrane preparations. The ATPase-dead mutants, K86A and K86M served as additional controls. All data are shown as mean and SEM. ****P < 0.0001; ***P < 0.001; **P < 0.01; *P < 0.1 vs. empty plasmid transfected HEK293 (mock). (F) Membrane localizations of GFP-tagged ABCG2 variants were visualized by confocal microscopy to detect GFP-tagged ABCG2 variants (green). Nuclear DNA was stained with DAPI (blue). Microscopy data are from duplicate experiments.

