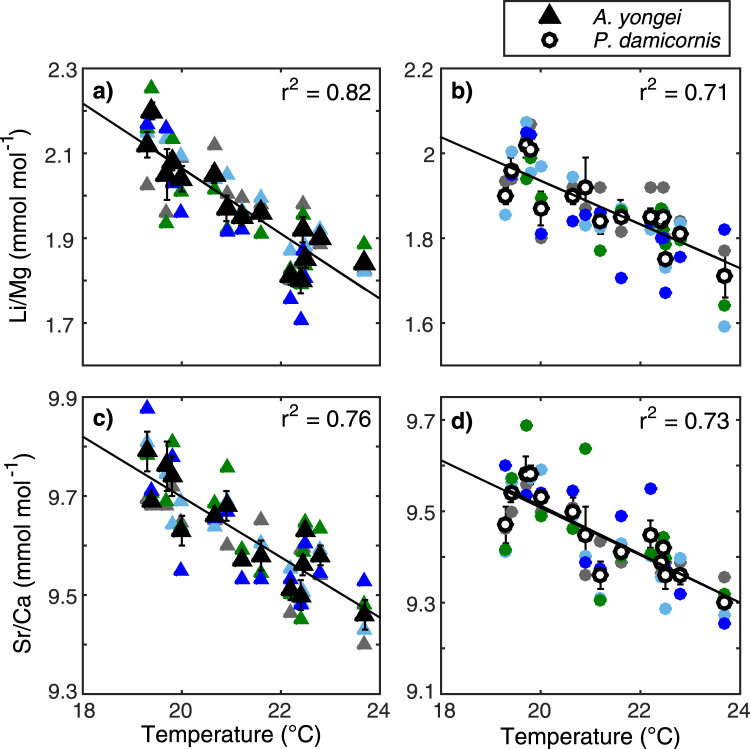
Figure 1.
Measured Li/Mg and Sr/Ca in corals at Rottnest Island plotted against seawater temperature. (a,b) Li/Mg plotted against temperature with regression equation Li/Mg = −0.08Tsw + 3.63 for Acropora yongei and Li/Mg = −0.05Tsw + 2.99 for Pocillopora damicornis (c,d) Sr/Ca plotted against temperature with regression equation Sr/Ca = −0.061Tsw + 10.92 for Acropora yongei, and Sr/Ca = −0.053Tsw + 10.57 for Pocillopora damicornis. Coloured symbols represent each colony while the black symbols with lines denote the mean (±1 SE; n = 4) for each time point.

