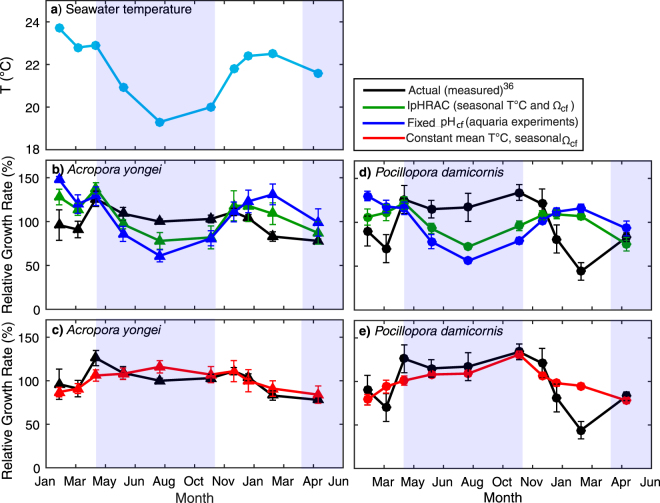
Figure 5.
Measured and modelled seasonal growth rate response for branching Acropora yongei and Pocillopora damicornis at Rottnest Island. (a) Seasonal changes in average seawater temperature (°C). Actual calcification rates measured using the buoyant weight technique36 and predicted calcification rates modelled using inorganic rate kinetics for (b,c) A. yongei, and (d,e) P. damicornis. Black symbols represent the measured calcification rates (mean ± 1 SE) for A. yongei (n = 16) and P. damicornis (n = 9)36. Green symbols represent the predicted calcification rates using seasonally varying temperature and seasonally varying Ωcf, blue symbols represent the predicted calcification rates using pHcf calculated from fixed condition experiments for Acropora spp., (y = 0.51pHsw + 4.2840,49; where pHsw ranged from 8.03–8.10), and red symbols represent the predicted rates using a constant mean temperature (21.7 °C) and seasonally varying Ωcf. All growth rates are expressed as percentage relative to the mean. Light blue shading denotes winter and unshaded areas denote summer, defined based on seasonal changes in temperature and light.

