Figure 3.

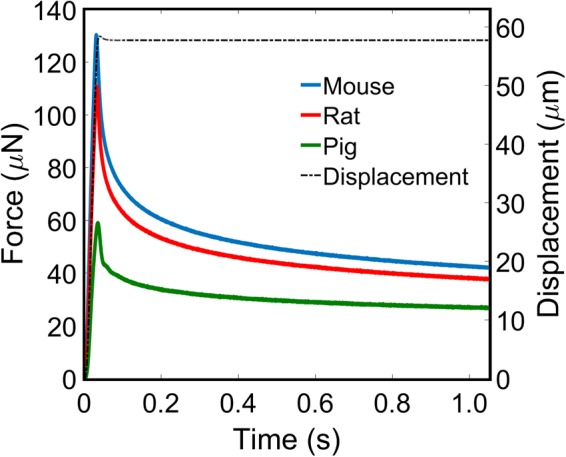
Mean force-time curves for the cortex of the mouse (blue), rat (red), and pig (green) brains. Velocity profile (black dash) of a 10/s indentation and 1 second relaxation. No filtering has been applied to the data.

Mean force-time curves for the cortex of the mouse (blue), rat (red), and pig (green) brains. Velocity profile (black dash) of a 10/s indentation and 1 second relaxation. No filtering has been applied to the data.