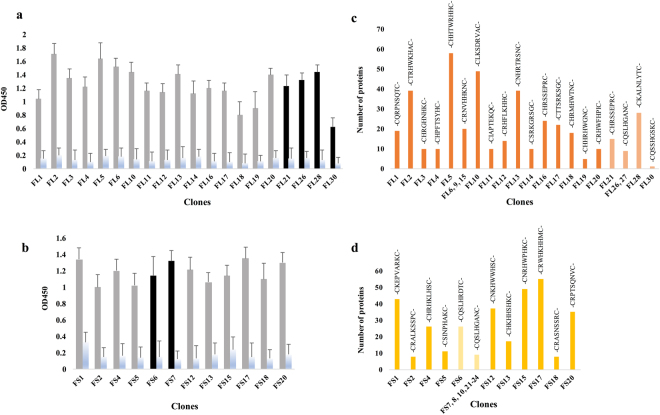
Figure 1.
Monoclonal phage ELISA and number of proteins predicted from each selected peptide. (a) Randomly selected NSCLC and (b) SM clones were screened by monoclonal phage ELISA; intensities are reported as mean ± SD. Columns 1–10 (grey) and 11–20 (black) belong to clones from SU and SL biopanning with the highest intensities, respectively, and the blue columns indicate the controls (bovine serum albumin (BSA)). Peptides identified with the purified IgG of (c) NSCLC patients (orange) and (d) SM (yellow) are plotted against the number of human proteins which matched to each sequence after blasting with a cut-off of 18.5 and manual deletion of unrelated entities. Mild orange (c) and (d) mild yellow indicate the peptides obtained from SL biopanning.

