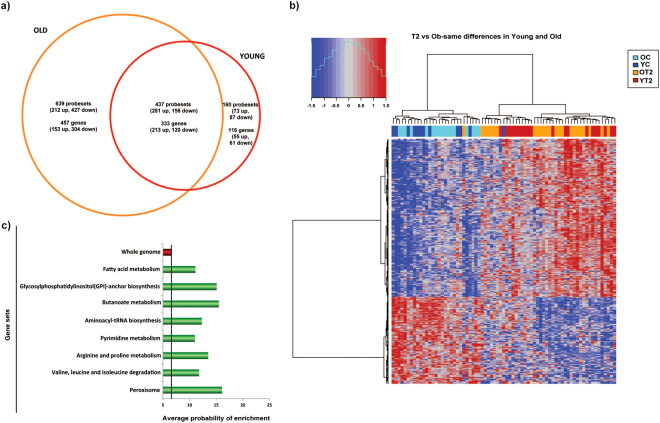
Figure 1.
Early-onset and classical forms of type 2 diabetes generate a gene signature. (a) Venn diagram depicting genes differentially expressed in muscle from type 2 diabetic patients compared with muscle from age- and BMI-matched nondiabetic subjects. (b) Heatmap of genes differentially expressed in muscle from type 2 diabetic patients. YT2 are early-onset type 2 diabetic subjects; OT2 are older type 2 diabetic subjects, and their respective controls are YC and OC. (c) GSEA of genes dysregulated in muscles from type 2 diabetic patients.

