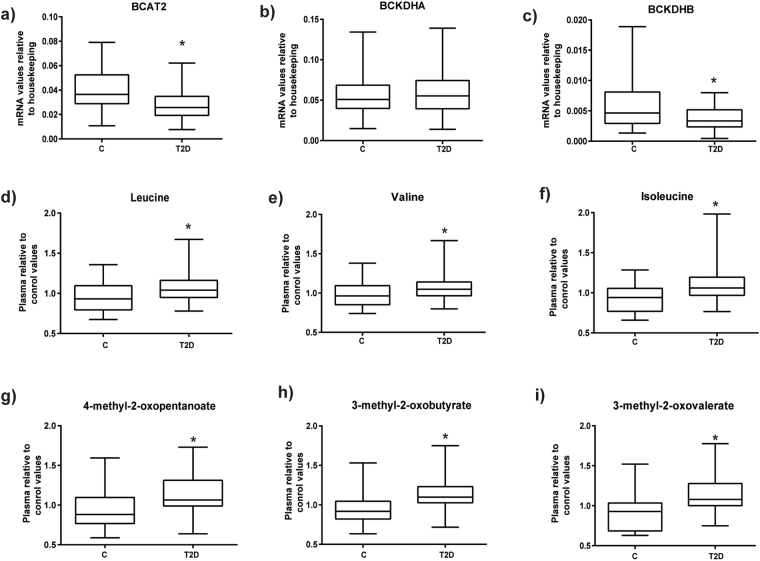
Figure 3.
Skeletal muscle gene expression of branched chain amino acids mitochondrial proteins in type 2 diabetic subjects (T2D) and their respective matched control groups (C). Real-time PCR was performed in skeletal muscle biopsies: (a) BCAT2, (b) BCKDHA, and (c) BCKDHB); Plasma metabolomics was performed in the same subjects and relative values are shown: (d) Leucine, (e) Valine, (f) Isoleucine and catabolites (g) 4-methyl-2-oxopentanoate, (h) 3-methyl-2-oxobutyrate and (i) 3-methyl-2-oxovalerate. Data are presented as mean ± standard deviation. Statistical analyses comparing type 2 diabetic subjects vs respective controls were performed by unpaired t-test *p < 0.05.

