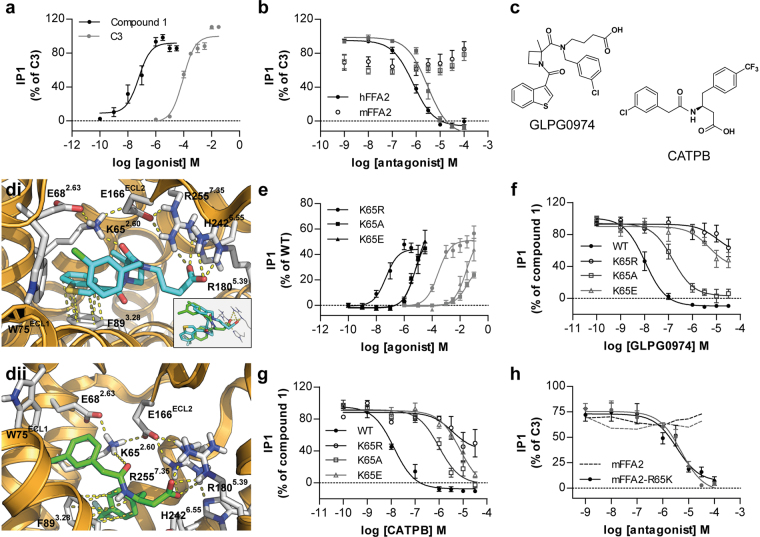
Figure 1.
Species selectivity of FFA2 antagonists for human versus mouse ortholog is determined by the identity of residue 65 in FFA2. Receptors of interest were expressed in-frame with eYFP in Flp-In TREx 293 cells. (a) The ability of varying concentrations of C3 ( ) and compound 1 (●) to promote production of inositol monophosphates was assessed. (b) The capacity of varying concentrations of either GLPG0974 (●) or CATPB (
 ) to inhibit inositol monophosphate production induced by EC80 concentrations of C3 at either hFFA2 (●) or mFFA2 (○) was assessed. (c) Chemical structures of GLPG0974 and CATPB are shown. (d) Docking of GLPG0974 (di) and CATPB (dii) into a homology model of hFFA2 with focus on the potential interaction of each ligand with Lys65 (residue 2.60). The insert highlights overlapping poses of GLPG0974 (cyan) and CATPB (green) within the binding pocket despite their structural differences (e). The ability of varying concentrations of C3 (
 ) and compound 1 (●) to promote generation of inositol monophosphates in Flp-In TREx 293 cells induced to express Lys65Arg (●), Lys65Ala (■), and Lys65Glu (▲) hFFA2 is illustrated. (f,g) The ability of GLPG0974 (f) or CATPB (g) to inhibit inositol monophosphate production induced by EC80 concentrations of compound 1 at wild type and each of Lys65Arg (○), Lys65Ala (□), and Lys65Glu (△) hFFA2 is shown. (h) The ability of GLPG0974 (●) or CATPB (
 ) to inhibit inositol monophosphate production induced by C3 at wild type (dotted line) and Arg65Lys (●) mFFA2 is illustrated.

