Figure 1.
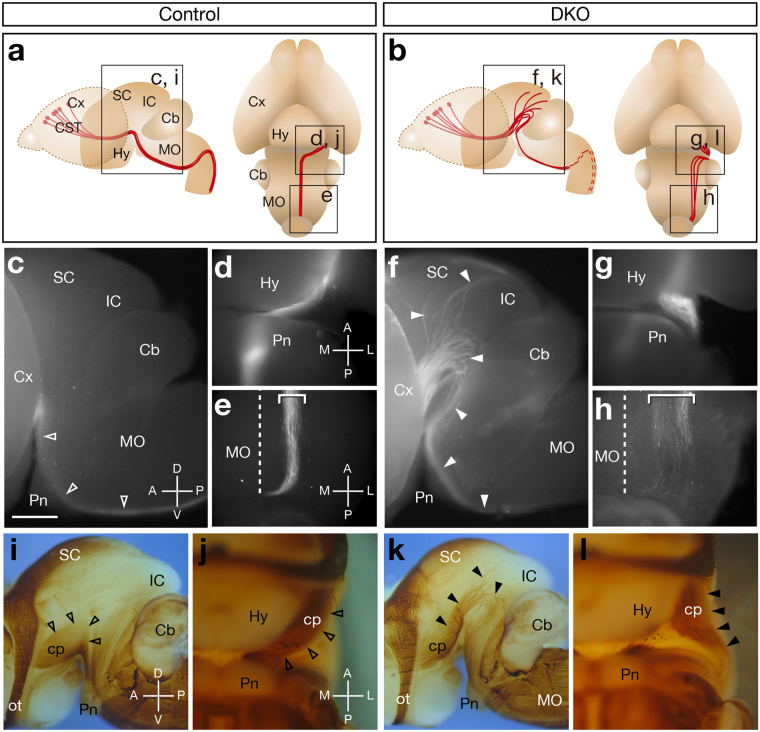
CST Axon Guidance Defects in Sulf1/2 DKO Mice. (a,b) Trajectory of the CST. Boxes show the areas of the pictures in (c–l). (c–h) Fluorescence images of P0 brains injected with DiI in the motor cortices. Lateral (c,f) and ventral (d,e,g,h) views of the control (Sulf1 −/−;Sulf2 +/−; c–e) and Sulf1/2 DKO brains (f–h) are shown. Sulf1/2 DKO mice showed abnormal defasciculated axons (closed arrowheads in f, box in b). The dashed lines indicate the midline. The average intensity of fluorescence signals in the midbrain area was significantly higher in the DKO mice than that in the control mice (18.388 arbitrary unit in control and 29.096 in DKO; n = 4, P = 0.018637 by Welch’s t-test). (i–l) Whole-mount neurofilament staining of the E18.5 brain. Lateral views (i,k) and ventral views (j,l) of control (Sulf1 −/−; i–j) and Sulf1/2 DKO brains (k,l) are shown. The cerebral cortices were removed. Abnormal fibers (closed arrowheads) were observed in the Sulf1/2 DKO brain (k,l). Open arrowheads in (i,j) indicate the normal cerebral peduncle. Statistical analyses of the neurofilament-positive fibers in the midbrain (i,k) are shown in Supplementary Table 1. Cb, cerebellum; cp, cerebral peduncle; Cx, cerebral cortex; Hy, hypothalamus; IC, inferior colliculus; MO, medulla oblongata; ot, optic tract; Pn, pons; SC, superior colliculus. Anterior-posterior (A-P), dorsal-ventral (D-V), and medial-lateral (M-L) body axes are shown. Scale bars indicate 750 μm (c,f), 500 μm (d,e,g,h), 1.0 mm (i,k), and 600 μm (j,l), See also Supplementary Fig. S1.

