Figure 3.
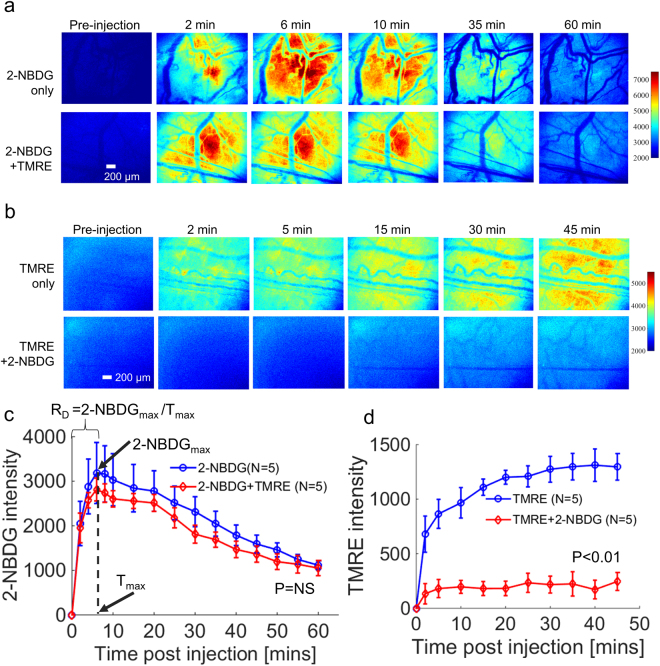
2-NBDG uptake is unchanged by simultaneous injection with TMRE, while TMRE uptake is significantly inhibited by simultaneous injection with 2-NBDG. 2-NBDG and TMRE kinetic imaging was performed on non-tumor murine dorsal window chambers after they received a simultaneous injection (2-NBDG + TMRE) or an independent injection (2-NBDG or TMRE alone). (a) Representative 2-NBDG uptake time course images for simultaneous injection and independent 2-NBDG injection. (b) Representative TMRE uptake time course images for simultaneous injection and independent TMRE injection. (c) Mean uptake kinetics of 2-NBDG. RD refers to the rate of delivery of 2-NBDG. 2-NBDGmax = the peak intensity of 2-NBDG. Tmax = time (in seconds) at which 2-NBDGmax occurs. (d) Mean uptake kinetics of TMRE. NS = not significant. N = 5 mice/group. Comparison of mean kinetic curves across animal groups was performed with a two-way Analysis of Variance (ANOVA) test using the MATLAB (Mathworks, USA) statistics toolbox.

