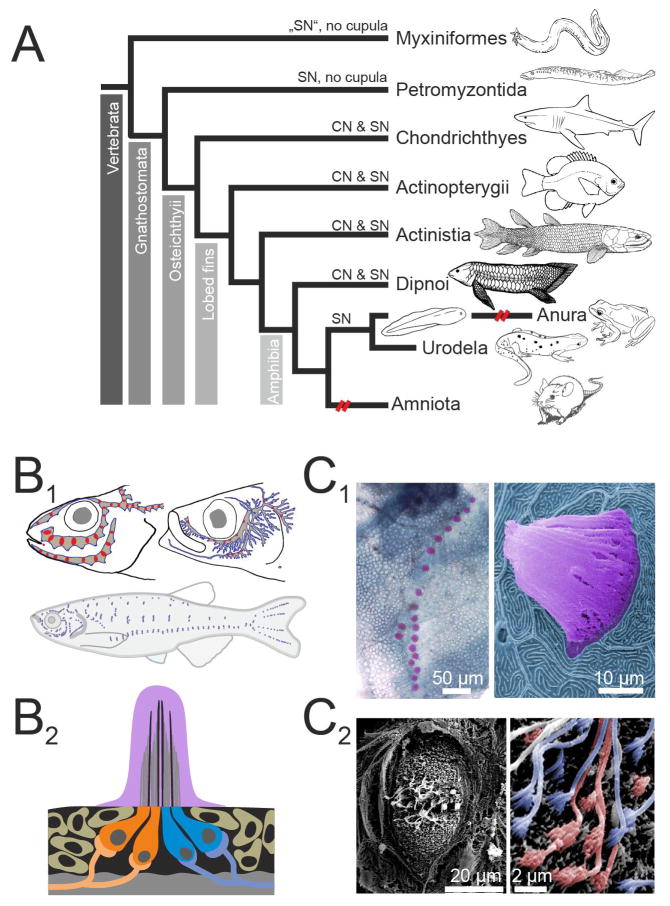
Figure 1.
Distribution and organization of the lateral line system A. Schematic cladogram of the distribution of lateral line mechanoreceptors across taxa. Secondary loss of the ancestral pattern is indicated by broken (red) lines. B. Schematics illustrating the varying distributions of superficial neuromasts (SNs; blue) and canal neuromasts (CNs; red) in three different species (Percarina demidoffi, Sprattus and Danio rerio; data modified after [Webb 1989b] (B1). Schematic illustration of a cross section through a superficial neuromast, coloration of cupula and hair cell somata corresponds to coloration used in photomicrographs (B2). Note that oppositely oriented hair cells are innervated separately. C. Photomicrographs show methylene green stained SNs of a scale on the trunk of an adult zebrafish (C1 left), and a colored SEM picture of a single SN including the cupula digitally colored in pink from an adult goldfish (C1 right). Photomicrograph of a goldfish SN following removal of the cupula (C2 left), with details of the hair cell polarization is shown in the magnified part (C2 right). Here hair cells of opposing orientation as determined by the position of their kinocilium and stereovilli are digitally colored in orange and blue.

