
Figure 3.
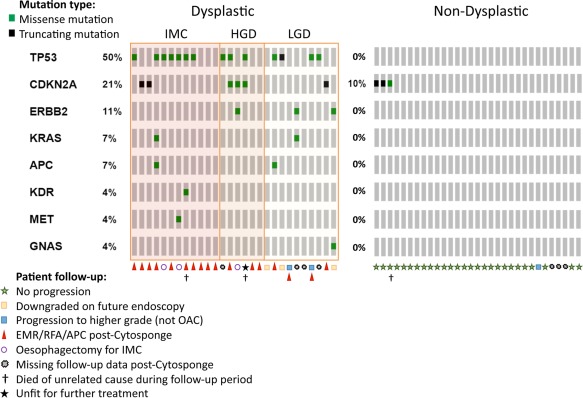
Gene plot showing genes mutated in each sample. Each vertical line of boxes represents one sample.
Official websites use .gov
A
.gov website belongs to an official
government organization in the United States.
Secure .gov websites use HTTPS
A lock (
) or https:// means you've safely
connected to the .gov website. Share sensitive
information only on official, secure websites.
Gene plot showing genes mutated in each sample. Each vertical line of boxes represents one sample.