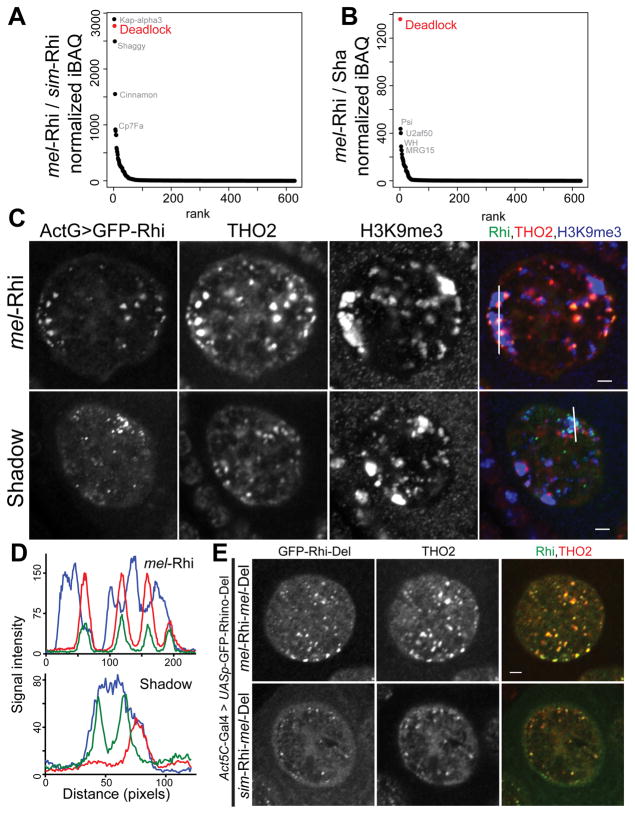
Figure 4. Cross species incompatibility in Rhi-Del interaction.
(A, B) Mass spectrometric analysis of Rhi binding proteins. Graphs showing ratios of GFP normalized iBAQ values for mel-Rhi vs. sim-Rhi (A), and mel-Rhi vs. Sha chimera (B), ranked by ratio values. Transgenes were expressed in melanogaster using the germline specific nanos-Gal4 driver.
(C) Localization of THO2 (piRNA cluster marker), H3K9me3 marked chromatin in the germline nuclei expressing Act5C-Gal4 driven Rhi:GFP. Color assignments for merged image shown on top. Scale bar: 2μm. Fluorescence intensities are measured along the line shown in merged image for Rhi:GFP (green), THO2 (red) and H3K9me3 (blue) as depicted in (D).
(E) Localization of Act5C-Gal4 driven Rhi-Del fusion proteins with respect to THO2 (piRNA cluster marker) in the female germline nuclei. Scale bar: 2μm.
See also Figure S4.

