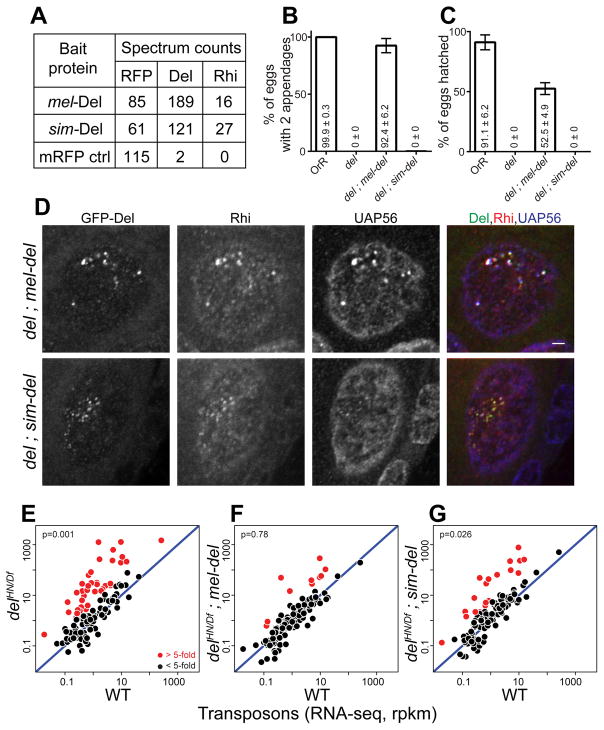
Figure 6. sim-Del binds to mel-Rhi, but fails to function in melanogaster.
(A) Mass spectrometric analysis of Del binding proteins. Table shows total spectrum counts for the mRFP tag, Rhi and Del in immunoprecipitates of mel-Del, sim-Del and mRFP control, expressed in the melanogaster germline under nanos-Gal4 driver. sim-Del co-precipitates with mel-Rhi.
(B, C) Bar graphs showing percentages of eggs with normal dorsoventral patterning (B) and percentages of hatched eggs (C) produced by females of the following genotypes: OrR (WT control); del mutant; del mutants expressing either mel-del or sim-del. sim-del fails to rescue embryo patterning and hatching. The numbers in/above the bars show mean ± standard deviation of three biological replicates, with a minimum of 100 embryos scored per replicate, except for del mutants where average of 7.33 eggs were scored.
(D) Localization of Rhi and UAP56 in del mutants expressing either mel-Del or sim-Del. Scale bar: 2μm (all images at same scale).
(E-G) Scatterplots showing transposon expression levels measured by RNA-seq in ovaries of del mutant (E), del mutant rescued by either mel-del (F) or sim-del (G) vs. WT control. Each point represents rpkm values for a different transposon. Diagonal represents x=y. Points in red show y/x>5. p value for differences is obtained by Wilcoxon test. sim-del fails to rescue transposon silencing.
See also Figure S5.

