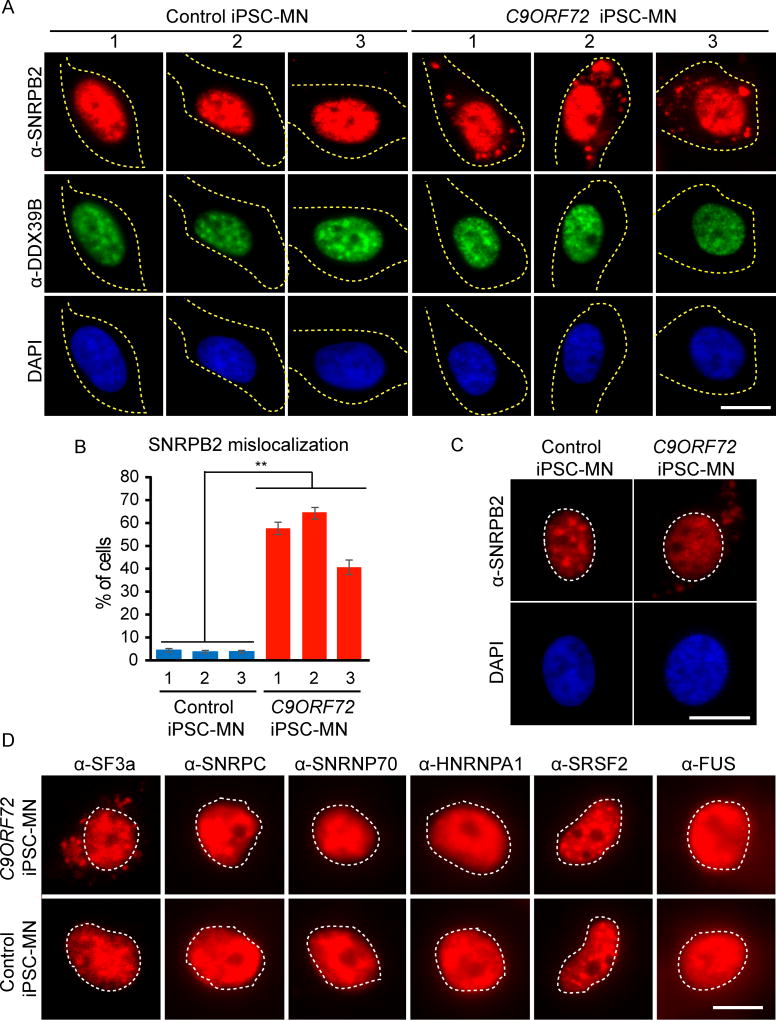
Figure 4. U2 snRNP is mislocalized to the cytoplasm in C9ORF72 iPSC-MNs.
(A) IF staining of SNRPB2 (red), DDX39B (green) and DAPI (blue) in iPSC-MNs from control subjects (N=3) or patients with C9ORF72 repeat expansion (N=3). Dotted line outlines the cell body. See Figure S3 for fields. (B) The percentage of cells with cytoplasmic SNRPB2 signals in each cell line. Mean ± SEM of 3 biological replicates is shown. Approximately 300 cells were counted for each line. **, p<0.001, two-way ANOVA. (C) Light exposure of IF staining using SNRPB2 (red) and DAPI (blue) in C9ORF72 iPSC-MNs. Dotted line outlines the cell nucleus. See Figure S4 for fields. (D) IF staining in patient or control iPSC-MNs using antibodies against SF3a, SNRPC, SNRNP70, HNRNPA1, SRSF2, and FUS. Dotted line outlines the cell nucleus. Scale bars: 20 µm.

