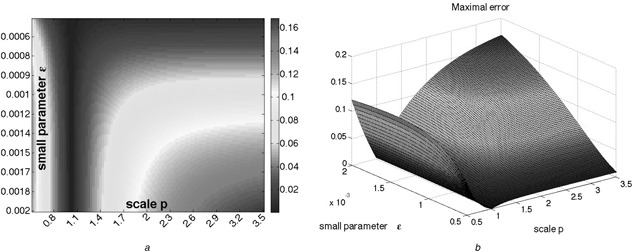
Fig. 9.

Simple feedback system
(a) Heatmap and (b) 3D plot representing the largest absolute value of the difference between the two outputs y 2 (t) and y 1 (t)
Parameter ε was sampled in the range [0.0005, 0.002] and p was sampled in the range [0.5, 3.5]
Hundred different parameters for each were selected
