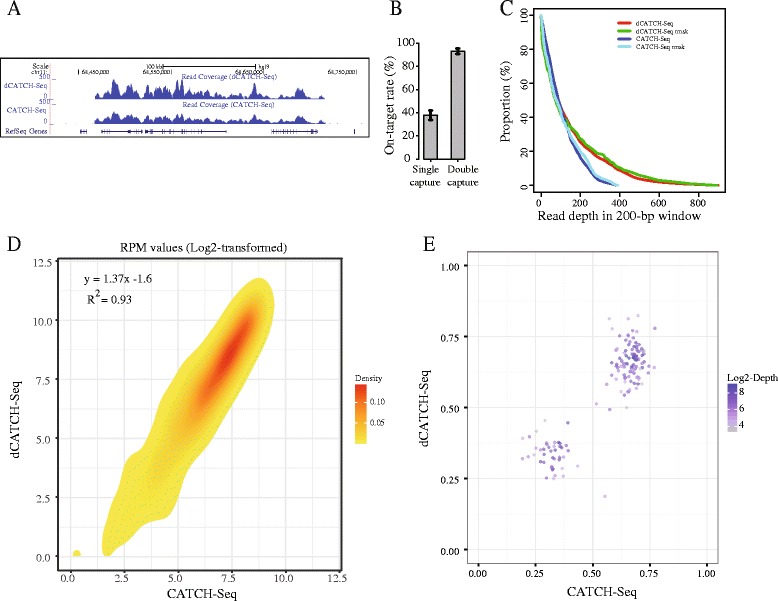
Fig. 1.

Comparison of double versus single hybridization capture approach. a Wiggle plot showing the coverage across an intended region on chr11 (chr11:68,467,857–68,716,491, hg19). Two tracks shown in dark blue are the read coverage in 50-bp bins for dCATCH-Seq and CATCH-Seq approaches (b) Barplot of on-target rates for single and double captures. Error bars are the standard deviations from technical replicates (n ≥ 5). c Plot of the proportion of reads against the read depth based on coverage in 200 bp non-overlapping windows across the intended region on chr11. Rmsk, repeat maskering, means plot based on the repeat masked read depth. d Density plot showing the comparison of read depth normalized by using log2-transformed RPM values between CATCH-seq and dCATCH-seq data. The linear regression equation and Pearson’s Correlation coefficient are shown in the left top corner. e Scatterplot showing the comparison of read depth (log2-transformed) for heterozygous variants called from CATCH-seq (x-axis) and dCATCH-seq (y-axis)
