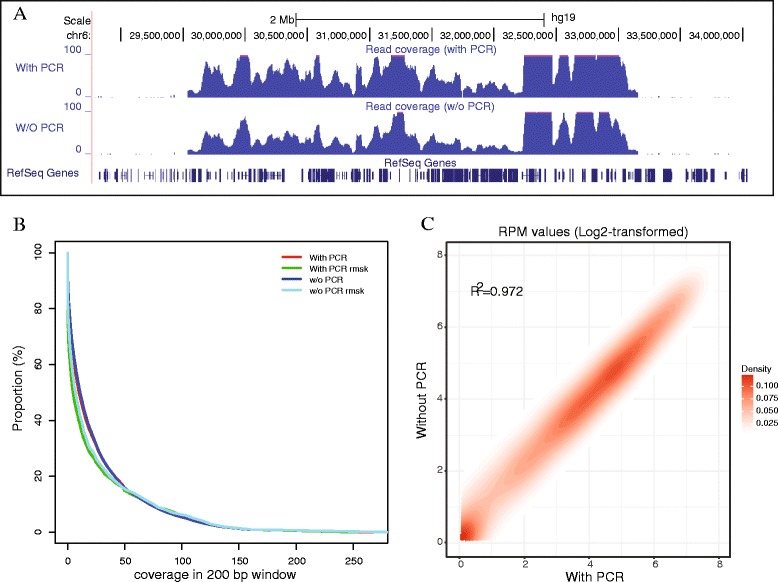
Fig. 2.

Double capture and sequencing of the MHC region in K562 cells. a Wiggle plot showing the capture of the human MHC region with a size of ~3.5 Mb (chr6:29,651,300–33,160,000, hg19) under two conditions (with PCR amplification or not). b Plot of the proportion of reads against the read depth based on coverage in 200-bp non-overlapping windows across the MHC region for the two conditions. Rmsk: repeat masker. c Density plot showing the comparison of read depth normalized by using the log2-transformed RPM value between two conditions
