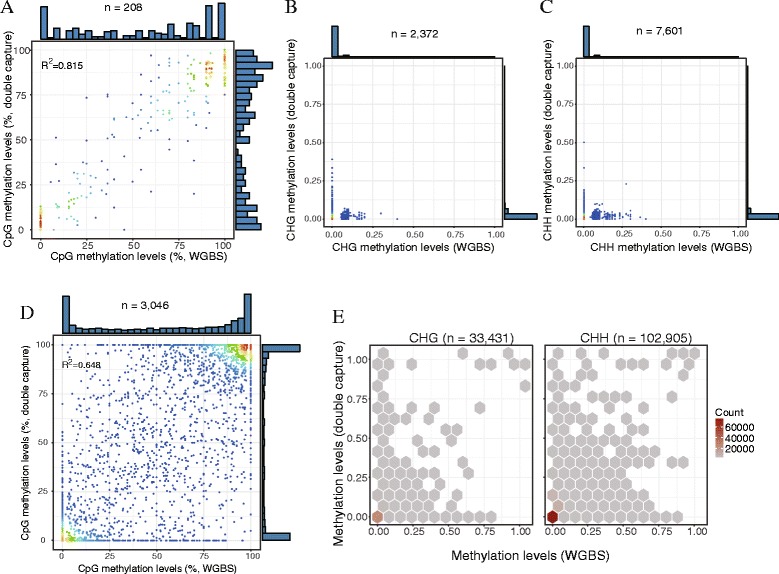
Fig. 4.

Identification of DNA methylation levels by double capture followed by bisulfite sequencing. Correlation of DNA methylation levels at a region on chr11 (a-c) and on the MHC region (d-e) identified by dCATCH-BSseq (y-axis) and whole-genome bisulfite-sequencing (WGBS, x-axis) techniques in the CpG, CHG and CHH dinucleotide contexts, respectively. Colorful dots shown in A-D denote the density of DNA methylation sites, and histograms shown outside the axes denote the distribution of DNA methylation levels
