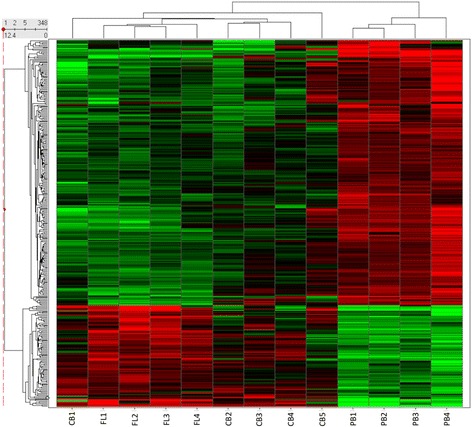
Fig. 1.

Differential gene expression when adult peripheral blood is compared to cord blood and fetal liver. A total of 264 genes were up- (FC > 2) or downregulated (FC < 2), when tissues with low HbF expression levels were compared to their counterparts with high HbF expression levels. Columns represent samples; rows are genes. Genes that were upregulated are depicted in red and genes that were downregulated are depicted in green
