Fig. 1.

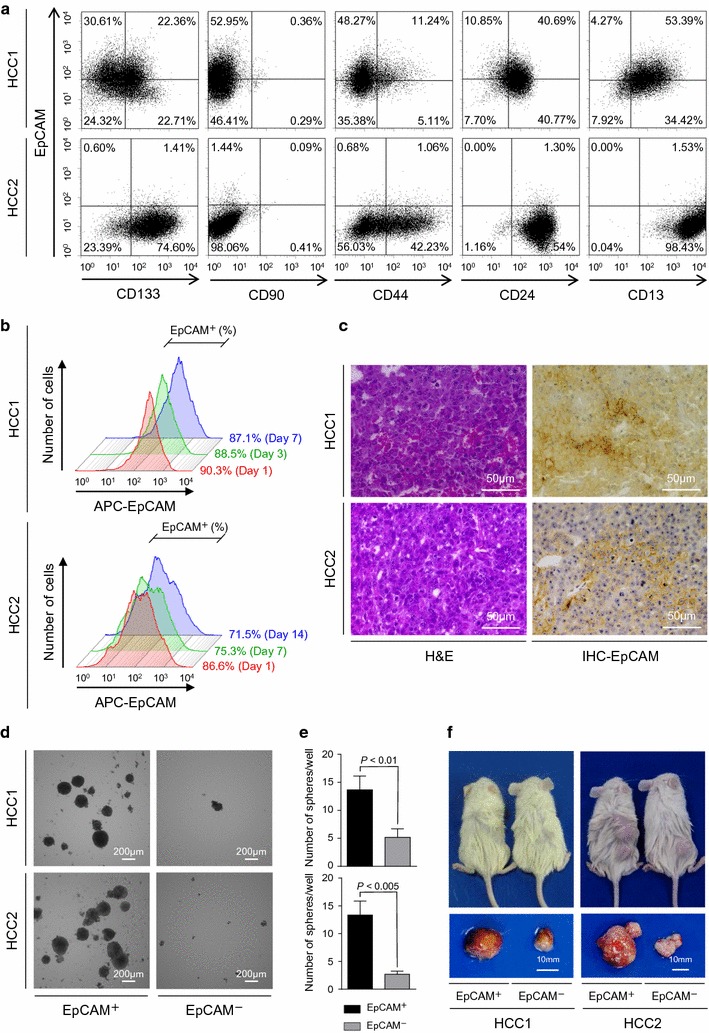
Hepatic stem cell marker expression in HCC1 and HCC2 cells. a Flow cytometry of HCC1 and HCC2 cells using fluorescently-labeled antibodies against EpCAM, CD133, CD90, CD44, CD24, and CD13. b Flow cytometry of EpCAM+ cells using an anti-EpCAM antibody. Figure shows EpCAM+ HCC1 cells on days 1, 3, and 7 after cell sorting and EpCAM+ HCC2 cells on days 1, 7, and 14 after cell sorting. c Histological analysis of EpCAM+ HCC1 and HCC2 xenografts. The figure shows hematoxylin and eosin (H&E) staining and anti-EpCAM immunohistochemistry (IHC) staining of the tumors. d Representative phase-contrast images of sorted EpCAM+ and EpCAM− HCC1 and HCC2 cell spheroids. e EpCAM+ and EpCAM− HCC1 and HCC2 spheroid formation. Experiments were performed in triplicate. Bars indicate the mean ± standard deviation. f Tumorigenic potential of EpCAM+ cells. Representative photomicrographs of NOD/SCID mice (upper panel) and subcutaneous tumors (lower panel) from EpCAM+ and EpCAM− HCC1 and HCC2 cell xenografts
