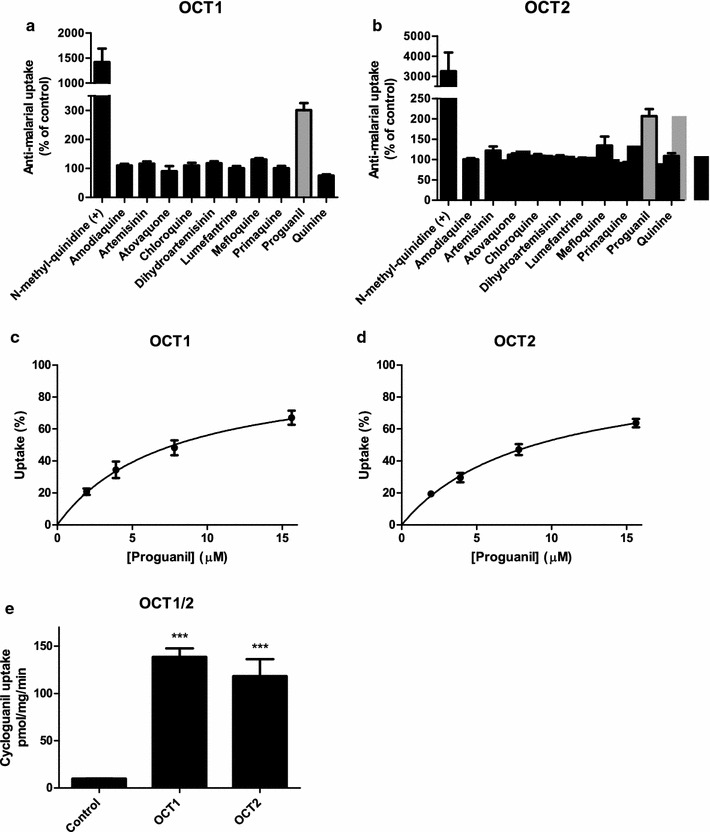
Fig. 2.

Anti-malarial uptake by OCT1 and OCT2, and uptake characteristics of PG. Uptake of 10 anti-malarials (AQ, ART, ATO, CQ, DHA, LUM, MQ, PQ, PG, and QN) at a concentration of 10 μM by OCT1 (a) or OCT2 (b) was measured after 15 min of incubation at 37 °C. NMQ served as a positive substrate for both transporters. Uptake was measured in pmol/mg protein/min and expressed as percentage of eYFP control. Anti-malarials showing at least a twofold uptake (grey bars) were selected for further analysis. Transport kinetics of PG during 1 min incubation at 37 °C resulted in a KM of 8.1 ± 1.6 µM and Vmax of 1840 ± 510 pmol/mg/min for OCT1 (c) and a KM of 9.0 ± 1.1 µM and Vmax of 4440 ± 1500 pmol/mg/min for OCT2 (d). Uptake of 100 µM CG for 5 min showed a significantly higher CG uptake for OCT1 (139 ± 9 pmol/mg/min) and OCT2 (118 ± 18 pmol/mg/min) compared to the control (9.7 ± 0.3 pmol/mg/min) (e). ***p < 0.001
