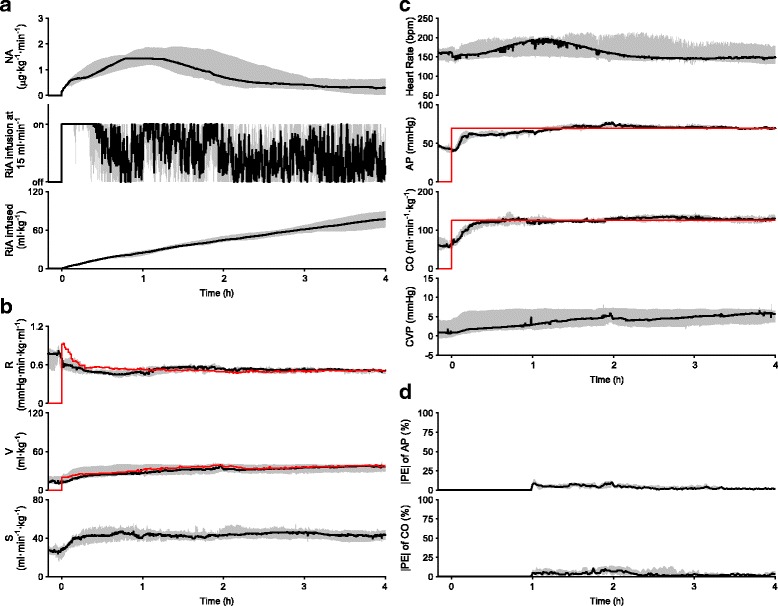
Fig. 2.

Closed-loop control of hemodynamic resuscitation in 8 dogs over the period of 4 h. Data are expressed as median (solid line) and interquartile range (gray area). a Time courses of NA infusion rate, on/off status of RiA infusion at 15 ml·min−1, and cumulated volume of RiA infused. b Time courses of cardiovascular parameters. Red lines indicate median target parameters (top; R*, middle; V*). R* and V* were recalculated every minute. c Time courses of hemodynamic variables. Red lines indicate median target hemodynamic variables (second from the top; AP*, third from the top; CO*). AP* and CO* were constant throughout the control period. d Time courses of absolute performance error (|PE|) for AP and CO
