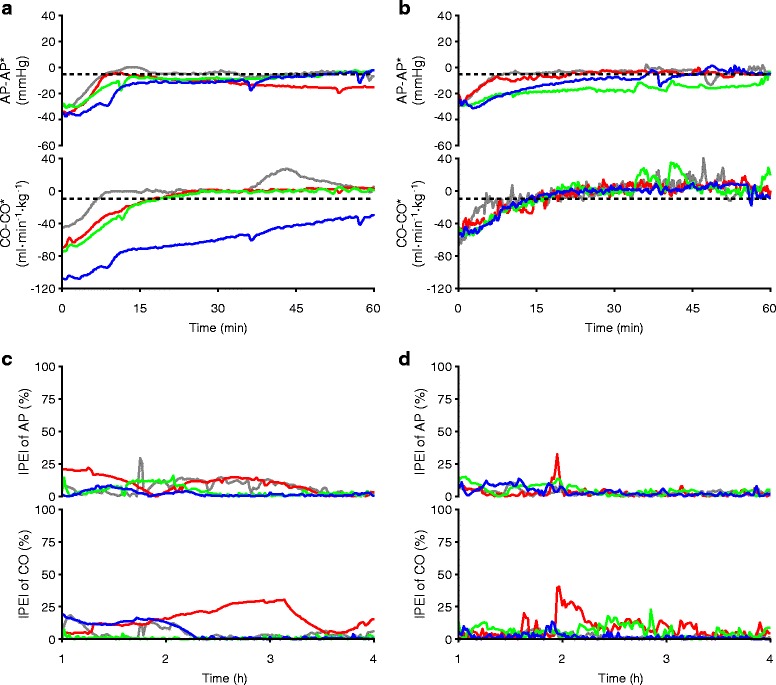
Fig. 3.

Effectiveness of control of AP and CO in each animal in group A and B. Data of each dog is color-coded as shown in the panels. a Time courses of AP-AP*, and CO-CO* in group A. b Time courses of AP-AP*, and CO-CO* in group B. Broken lines in a and b correspond to predefined acceptable ranges. c Time courses of |PE| for AP and CO in group A. d Time courses of |PE| for AP and CO in group B
