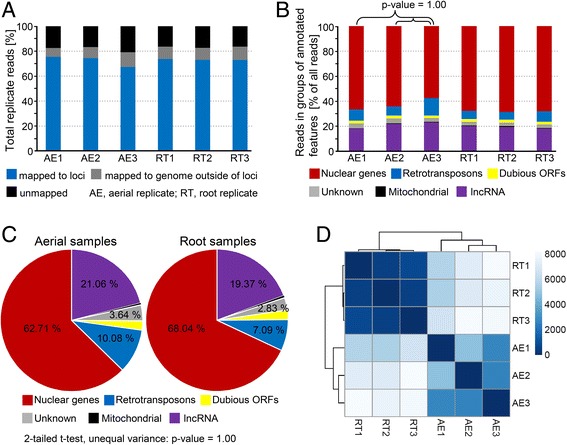
Fig. 2.

Read alignment statistics and counting results for individual replicates of aerial (AE) and root (RT) samples. a Percentages of reads mapping to annotated gene loci or intergenic regions and unmapped reads. b Percentages of reads mapped to lncRNA loci, mitochondrial loci, retrotransposons, loci encoding putative/unknown proteins, dubious ORFs and other nuclear loci. c Mean percentages of aerial and root sample reads mapped to different feature types. d Sample similarity map generated in R using the Bioconductor package; intensity of color is proportional to similarity, measured by Poisson distance
