
Figure3.
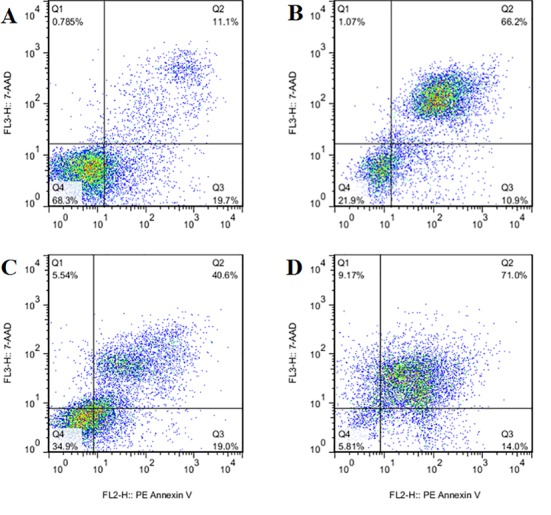
Representative flow cytometry charts illustrating percentage of live cells (Q4), early apoptotic cells (Q3), late apoptotic cells (Q2) and necrotic cells (Q1) in control cells (Chart A), cells overexpressing NDRG2 (Chart B), X-ray treated cells (Chart C) or NDRG2 overexpressing cells which treated with X-ray radiation (Chart D). As can be seen in chart D combination of NDRG2 overexpression and X-ray radiation increased percent total cell apoptosis (early apoptotic cells+ late apoptotic cells) as well as cell necrosis in a synergistic manner.