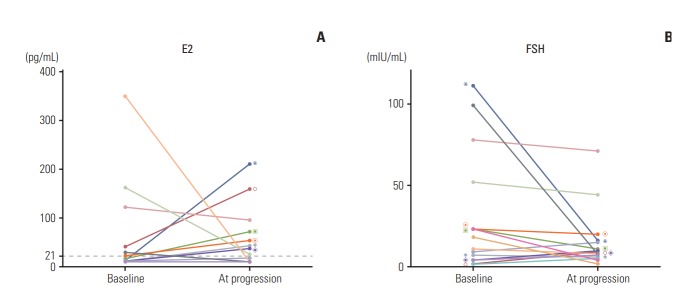
Fig. 3.
The line charts show the individual changes in estradiol (E2) (A) and follicle-stimulating hormone (FSH) (B) between baseline and at progression in patients treated with aromatase inhibitors and gonadotropin-releasing hormone agonist. The value of same individuals on each graphs are marked with same symbols. Only patients with increased E2 levels compared to baseline are marked.

